Handling production issues on the factory floor promptly is crucial. Determining the cause is paramount; understanding precisely what led to the problem and how it might be prevented in the future is essential. To identify potential causes of a problem, you can utilize the fishbone diagram. In this blog, you will learn what the fishbone diagram entails and how to create one yourself.
What is the fishbone diagram?
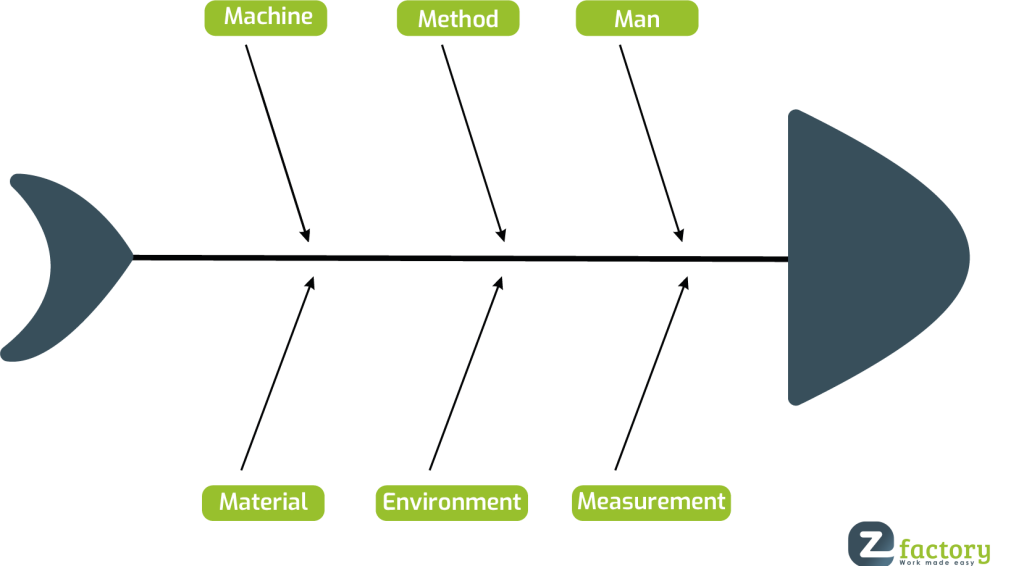
The fishbone diagram goes by various names, including the cause-and-effect diagram and the Ishikawa diagram. Mr. Ishikawa developed this diagram to visually arrange the causes of a problem. Therefore, the explanation of the fishbone diagram is also applicable to the Ishikawa diagram. Creating a fishbone diagram involves brainstorming with all employees involved in the problem and experiencing its consequences. Together, they brainstorm possible causes of the problem, visually represented in the fishbone diagram (or Ishikawa diagram). The name ‘fishbone diagram’ is derived from its appearance: resembling a head and a tail with several bones in between.
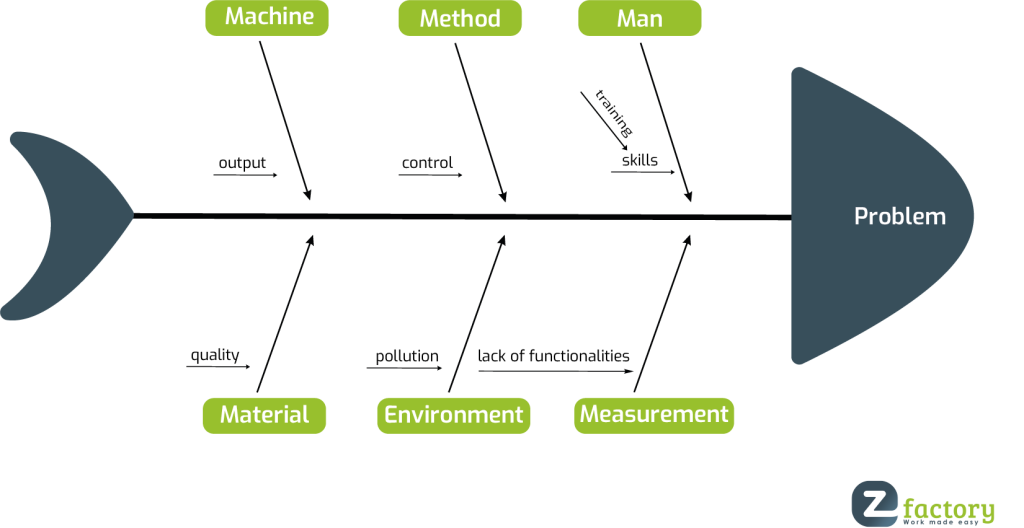
 These bones represent categories that aid in structuring and subdividing the potential causes derived from the brainstorming session: Man, Method, Machine, and Material. Apart from these fixed categories (bones) of the fishbone diagram, you can choose to add more themes, such as Environment, Management, Market and Measurement.
Fishbone diagram: Causes and effects
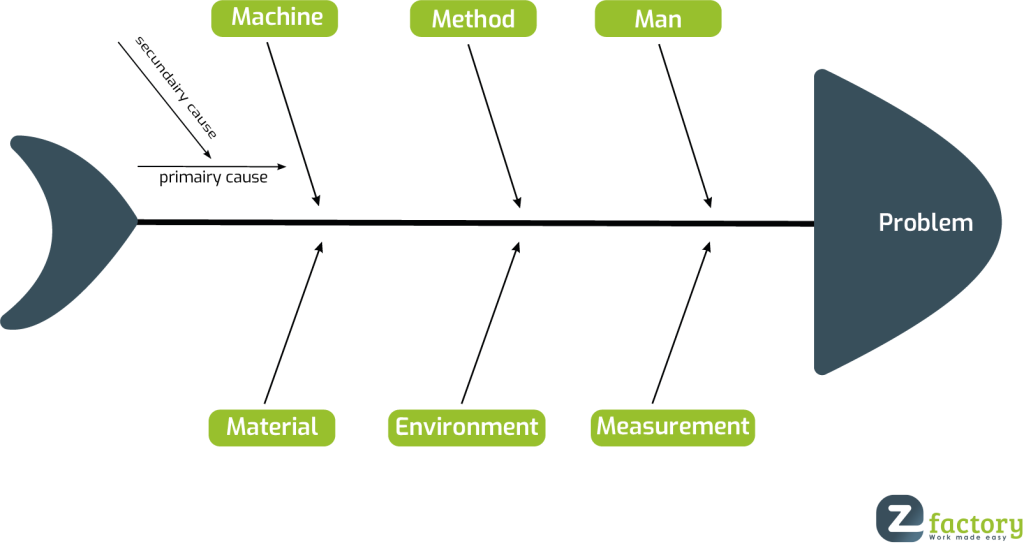
In a complex production process, pinpointing a cause leading to a notable effect is not always straightforward. Which step in the production process is responsible for the cause? To visually arrange causes and effects, the fishbone diagram is used. A crucial question to continue asking is: Why does this happen? Repeating this question for each possible cause delves deeper into the problem, potentially discovering additional (sub)causes that can be addressed to enhance the production process. This approach not only uncovers the cause linked to the problem analysed in the fishbone diagram but might also reveal additional areas for improvement.
How to create a fishbone diagram? (Example)
Setting up a cause-and-effect diagram using the Ishikawa method starts with drawing the diagram: a head, a tail and the bones in between representing categories. Draw a straight line from tail to head and connect the bones to it. Write the problem in the head of the diagram, entirely on the right side. For production issues, it’s common to add six bones: Man, Machine, Material, Method, Environment, and Measurement.
 You’ll find this layout in the fishbone diagram example above. All employees involved in identifying the problem’s cause can then brainstorm about all possible causes and categorize them. Then, filter the most relevant causes and ask one question for each cause: If we eliminate this cause, will the problem be (almost) resolved? If you find one or more possible causes where the answer to this question is ‘yes,’ you have identified the trigger points to address the problem, reducing or completely eliminating it from the production environment.
Implementing a fishbone diagram in your organization
Firstly, it’s crucial to determine the problem you want to use as the basis for the brainstorming session when creating a fishbone diagram. You might want to understand why step one of the production process needs to be repeated 5% of the time or investigate the reason for delays occurring at step five compared to the planned production time. Once the problem is defined, gather the involved employees and brainstorm and analyse following the method outlined above. Once you have identified the culprit (the cause), address it and incorporate the new method into the work instructions for the employees to prevent the problem in the future. This can be done quickly and easily using an online platform like the EZ-GO app. If you’re unfamiliar with the EZ-GO platform and how it can optimize the production process, don’t hesitate to reach out!


